

Throughout 2024, the Well-Being Index collected over 97,000 assessments from physicians, nurses, residents, fellows, and other healthcare professionals. After analyzing all anonymized assessments, the 2024-2025 State of Well-Being Report is now live, and is your comprehensive view of key trends, risks, and opportunities for institutions to leverage to improve healthcare professionals’ well-being.
Physician Well-Being Report
The report’s results include data from 23,498 physician self-assessments. The data from these tens of thousands of physician wellness assessments are summarized into three reports:
- Mean Distress Score
- Well-Being Snapshot
- Likelihood of Outcomes
All of these reports aim to indicate distress and well-being in the national physician population.
Mean Distress Score
The Mean Distress Score represents an entire group with one single number. So, rather than showing nuance, it provides a quick indication of whether distress is increasing or decreasing over time within a group.
For physicians, the Mean Distress Score scale is -2 to 9. The higher the number, the higher the indication of distress is within the whole group.
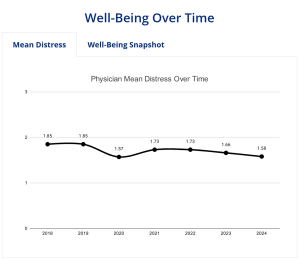
From the 23,498 physician assessments the Well-Being Index collected from January 1, 2024, to December 31, 2024, there’s an indication of decreased distress from the previous year (2023). The Mean Distress Score shows a decrease of .08 points from 2023 to 2024, and a 0.27 decrease from 2018 when the score was first used.
Well-Being Snapshot
The Well-Being Snapshot sorts Well-Being Index assessment results into four categories: Distressed, Struggling, Okay, and Thriving. The Snapshot is designed to offer organizations a clearer picture of the overall well-being of their groups at specific moments in time. The ability to compare well-being levels at different times helps to indicate whether a wellness intervention is working or needs refinement.
Well-Being Over Time
In the case of the 2024-2025 State of Well-Being Report on physicians, the “group” consists of all 23,498 physicians who took the assessment in 2024. The 2024 results can be compared to past years to gauge overall physician distress and well-being.
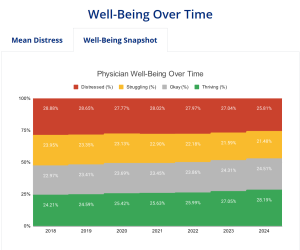
Compared to previous years, the 2024 physician Well-Being Snapshot indicates increases in the Thriving and Okay categories, as well as decreases in the Distressed and Struggling categories.
Wellness leaders should be encouraged by the 3.6% increase in the Thriving and Okay categories from mid-pandemic 2021 to 2024. As well as the 3.6% decrease in the Distressed and Struggling categories.
Even so, it’s important to remember that wellness is a drumbeat that, if interrupted even for a short period, can have dire consequences on the individual and the organization. Consistency and constant refinement are keys to keeping the drumbeat going strong.
Well-Being by Specialty
Based on each physician’s anonymized individual score, the Snapshot by Specialty shows the distribution of specialties across the entire continuum.
In other words, you can see by the Snapshot that each specialty (e.g., Family Medicine) scores uniquely on the scale from Distressed to Thriving.
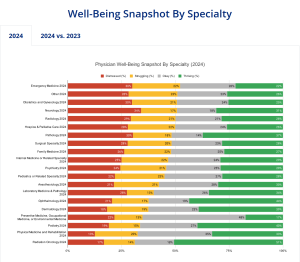
Click here to see Well-Being Snapshot by Specialty 2024 vs. 2023 results.
According to the 2024 Physician Well-Being Snapshot by Specialty, a higher portion of Radiation Oncologists are thriving in their well-being (51%) compared to all other specialties, with Ophthalmology coming in second at 44%.
The specialty thriving the least at 17% is ‘Preventive Medicine, Occupational Medicine, and Environmental Medicine.’ However, this specialty owns the largest segment of the Okay category at 48%, and a Distressed score of 22%. In comparison, Neurology has a Distressed score of 34%, ranking it highest in that category. Several specialties are tied for second in Distressed at 30%, including Emergency Medicine, Obstetrics and Gynecology, and Pathology.
This is to say, a low Thriving score doesn’t necessarily mean a high Distressed score, and vice versa. While Neurology came in highest for Distressed, it also came in at the high end of the pack for Thriving at 31%.
Therefore, wellness leaders shouldn’t disregard their specialty’s Distressed score due to a high Thriving score — there’s clearly a more nuanced discrepancy within the group. It’s essential to keep this in mind when looking at the Snapshot by Specialty reporting, whether for your own organization or the national numbers.
Likelihood of Outcomes Grid
The Well-Being Index’s new Likelihood of Outcomes Grid shows the risk levels of specific outcomes, like burnout and medical error. The 23,498 physician assessments from 2024 were scored from highest to lowest likelihood for each outcome according to a likelihood ratio.
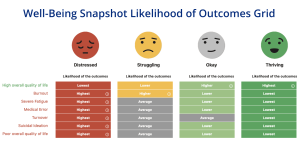
What this gives us is a more detailed look at physicians in each category (Distressed, Struggling, Okay, and Thriving). The likelihood of a Distressed physician having a high overall quality of life is LOWEST compared to their Struggling, Okay, and Thriving peers. While, at the same time, the likelihood of a Distressed physician experiencing burnout, severe fatigue, medical error, turnover, suicidal ideation, and poor overall quality of life is HIGHEST.
This might sound obvious at first — predictably, a Distressed physician is most at risk for the negative outcomes and least at risk for the positive ones. However, it’s when we look at the middle of the continuum that we find less expected results.
A physician who is Struggling is still at great risk of burnout. And, even though they didn’t score Distressed levels, they’re still on average at increased risk of experiencing severe fatigue, medical error, turnover, suicidal ideation, and poor overall quality of life.
Just because they’re not yet in the Distressed category doesn’t mean there’s no risk of a Struggling physician making a medical error or ideating about suicide. The risk is still very prevalent. Wellness leaders cannot ignore the possibility that Struggling and Okay physicians experience the same outcomes as those Distressed.
Additionally, without intervention, how long until a Struggling physician falls into the Distressed category? The insights we glean from the Likelihood of Outcomes Grid should help us pinpoint the outcome that most needs addressing. That way, we can address the specific outcome across the board, intervening at the Distressed, Struggling, and Okay levels, and continuing support for Thriving physicians.
Turn Insights into Action
The Mayo Clinic-invented and validated Well-Being Index collected over 23,000 physician wellness assessments in 2024. And, by the looks of the 2024-2025 State of Well-Being report, physician distress is decreasing overall.
This doesn’t mean, however, that we can let up on data-driven wellness initiatives. While the drumbeat of wellness continues to grow stronger, leaders can’t get distracted. Supporting physician well-being is a constant effort that must be consistently measured for effectiveness. Otherwise, the drumbeat will grow quieter until it eventually stops altogether.
Explore the full 2024-2025 State of Well-Being report for free to uncover even more data from 97,000+ clinician assessments, including…
- 23,498 physician assessments
- 13,975 nurse assessments
- 12,618 resident and fellow assessments
- 8,388 APP assessments
- 25,500 healthcare employee assessments
If you’re curious about how to glean similar insights for your own organization, consider talking to a Well-Being Index expert. The sooner you capture the needed insights, the sooner you can take action.